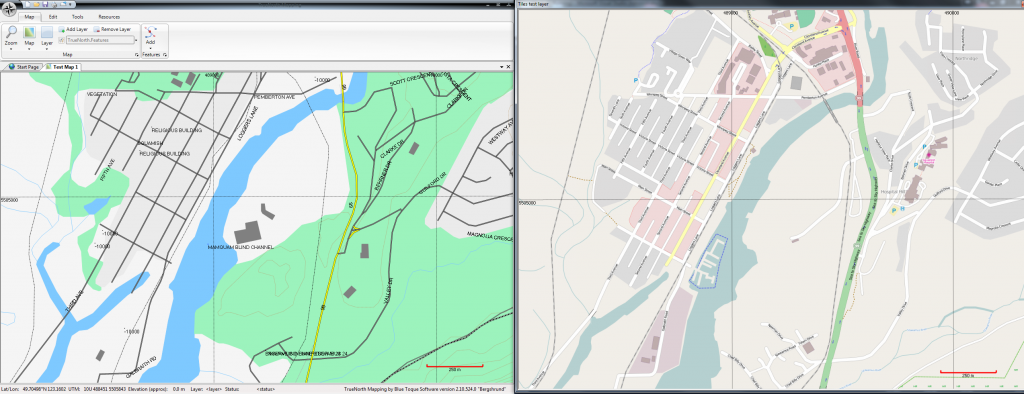
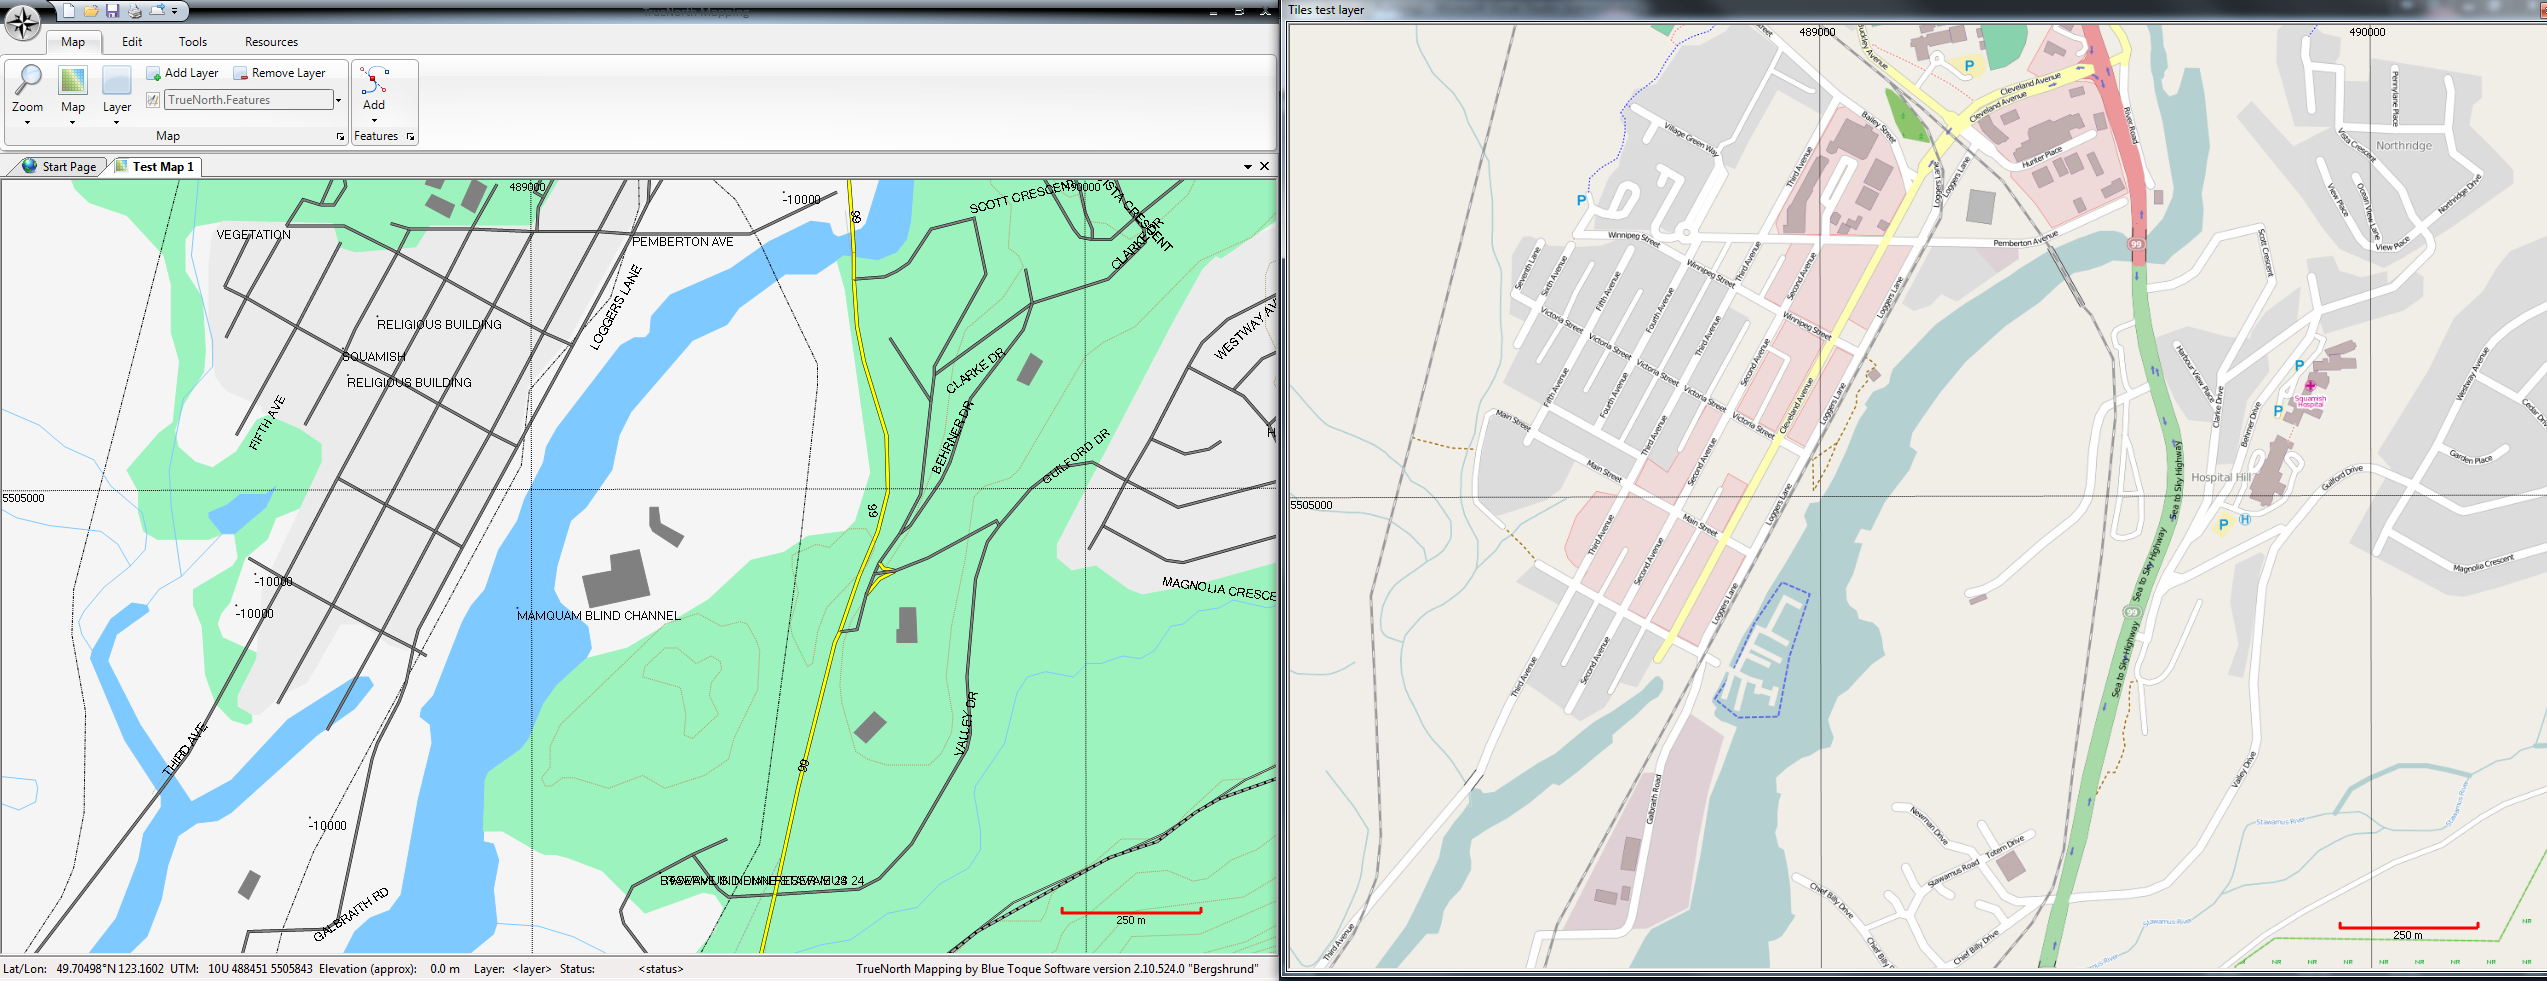
Today we had a bug to fix; some eagle-eyed readers may have noticed that the scale bar was incorrect in the previous two screenshots. In the process of fixing the bug we found that it was useful to compare the same area drawn in two separate map windows using different base map data: one using the Topographic Map of Canada, the other using OpenStreetMap.
The screenshot below shows the result; two maps open, the one on the left is “docked” in the main window, the one on the right is “floating”. It just so happens that we have a dual screen setup on this development system, so each window is on it’s own physical screen. Each map can be panned and zoomed independently. We’re using the downtown area of Squamish in each window.

TrueNorth also supports two views of the same map, but that’s for another day’s post.
This mode shows how data from different sources can be valuable; the topographic map gives a much better picture of the land cover (forested regions are in green), where the OpenStreetMap has more detail on the buildings at the Squamish hospital, and you can see the floats of the government wharf and Squamish Yacht Club.

Leave a Reply
You must be logged in to post a comment.